THIS ARTICLE IS MORE THAN FIVE YEARS OLD
This article is more than five years old. Autism research — and science in general — is constantly evolving, so older articles may contain information or theories that have been reevaluated since their original publication date.
A new set of charts shows how brain connections can change as children grow, and indicates that people with attention problems have altered patterns of brain connections1.
The atlas could serve as a reference for identifying problems with attention in young children. Up to 80 percent of children with autism have attention deficit hyperactivity disorder (ADHD).
Pediatricians routinely rely on normative growth charts — showing how height, weight and head circumference change with age — to identify children with developmental delay. The new work creates charts for the maturation of connections in the brain.
In the study, published in April in JAMA Psychiatry, researchers relied on brain scans from 519 people between 8 and 22 years old, including 25 with ADHD. The data came from the Philadelphia Neurodevelopmental Cohort, a sample of more than 9,500 children and young adults from the general population.
The scans involved functional magnetic resonance imaging, which measures blood flow in the brain as a stand-in for neural activity. Participants lie in the scanner, not engaged in any particular task, and the scans reveal networks of brain regions that activate or deactivate in sync.
Delayed development:
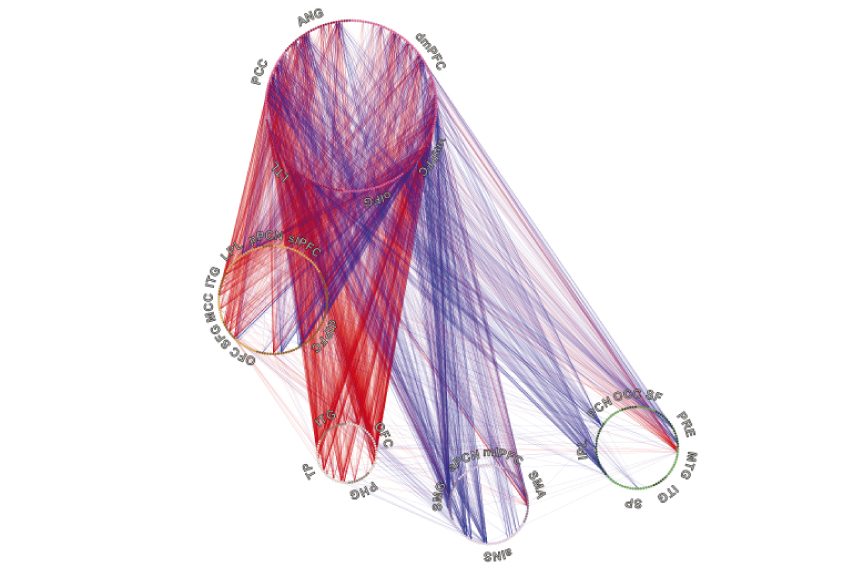
The researchers identified 15 patterns of connectivity within or among established brain networks that vary in degree of synchrony across the participants. They assigned each participant a score that reflects the expression of each pattern in his brain. By plotting the scores for each age on the same graph, the team developed a growth chart for each pattern that reflects what is typical at each age, from age 8 to 22.
The researchers then assigned scores to the participants that indicate the extent to which each of the 15 patterns is more or less developed than expected for their age.
The participants also took an attention test. They pressed a key whenever a series of lines on a computer screen took the shape of a number or letter (as opposed to a random pattern). The researchers found that individuals who have immature brain connections for their age tend to perform poorly on this test, indicating that they have difficulty staying on task.
The researchers found that these maturation scores relate to ADHD diagnosis. Specifically, individuals with delayed development of any of 3 of the 15 patterns are about twice as likely as the others to have ADHD. The findings hint that brain connection patterns, if examined early in life, may serve as markers for risk of attention problems later.
By joining the discussion, you agree to our privacy policy.