THIS ARTICLE IS MORE THAN FIVE YEARS OLD
This article is more than five years old. Autism research — and science in general — is constantly evolving, so older articles may contain information or theories that have been reevaluated since their original publication date.
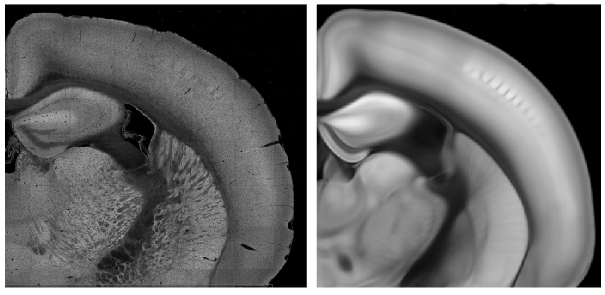
A 3-D anatomical map of a mouse brain shows the precise position and structural detail of various brain regions. The model is based on averaging brain images from more than 1,500 mice. Researchers debuted the resource today at the 2017 Society for Neuroscience annual meeting in Washington, D.C.
The map could serve to illustrate how the brain is altered in mouse models of autism.
Researchers initially created the map based on a single mouse brain, manually drafting it in a computer program from two-dimensional images. They then converted those illustrations into 3-D images using algorithms.
To make the new map, the team overlaid information, such as gene expression data, from many other datasets onto structural imaging data from the Allen Institute for Brain Science in Seattle. This allowed the researchers to precisely define the edges of brain regions. The team then averaged the images from 1,675 mouse brains.
The process took years, says David Feng, associate director of technology at the institute, who presented the model. “We’ve created this really beautiful average mouse brain,” he says. “What you see remaining after all the averaging we do is very sharp definitions of structures that are stereotypical, which means there’s not a lot of wiggle room anymore.”
Master map:
The map sharply defines more than 500 gray-matter structures, which include the cell bodies of neurons; white-matter tracts, which are composed of nerve fibers that connect neurons, and other brain sections.
For instance, the barrel cortex, which receives sensory information from a mouse’s whiskers, appears as small, even lines within the brain’s outer layer. By comparison, this same region is blurry and nearly indistinct in an image of a single mouse brain.
The atlas also allows researchers to compare different datasets. For example, researchers can overlay their own data, such as specific cell locations, onto the map to determine the brain region where cells reside or connect to, Feng says.
“When we map a signal into [the map], we can be more confident about saying, ‘Yeah, this is in the motor cortex,’” he says.
The map is publicly available on the Allen Institute’s website.
For more reports from the 2017 Society for Neuroscience annual meeting, please click here.
By joining the discussion, you agree to our privacy policy.