An open-source tool enables researchers to quickly compare brain maps plotted in different coordinate systems, such as those derived from MRI scans or microarray probes.
The tool, called neuromaps, addresses a core problem that has long plagued neuroscience. As large brain-mapping repositories such as the Allen Brain Atlas and NeuroVault continue to swell in size, tools to easily collect, compare and run statistical analyses across these datasets have lagged behind.
“We’ve been collecting huge amounts of data for a decade in neuroscience, and they all just kind of sit somewhere,” says Bradley Voytek, professor of cognitive science at the University of California, San Diego, who peer-reviewed the study describing neuromaps, which appeared in Nature Methods in October. “This [tool] allows you to bring them together and integrate them.”
The neuromaps software is freely available online and built from three main components: a repository of datasets, and tools to both transform brain maps and apply statistical methods.
The team behind the tool initially envisioned it as a data repository for neuroimaging data, says study investigator Justine Hansen, a neuroscience graduate student at McGill University in Montreal, Canada. But after emailing dozens of neuroscience labs and collecting their published data, she and her colleagues debated how to best make it all available.
“Do we transform all these data into the same [coordinate] space, or do we make them available in each space so there are repeats?” Hansen says. In the end, they decided to “provide all the tools needed to transform and parse data into the spaces researchers are interested in.”
T
Neuromaps comes pre-loaded with functions to transform brain maps across four different coordinate spaces commonly found in neuroscience datasets, including ‘fsaverage’ — the de facto system for the FreeSurfer software — and MNI-152, a coordinate system created by averaging MRI scans from 152 healthy people.
And neuromaps has a suite of tools to examine relationships across brain maps and perform statistical analyses. Brain regions close to each other tend to be autocorrelated, meaning they resemble each other more closely than they do distant brain regions; neuromaps accounts for these spatial patterns and minimizes the chances of bloated p-values.
“We made this really for ourselves, to make our lives easier,” says lead investigator Bratislav Misic, associate professor of neurology at McGill University. “We were constantly doing stuff like this on our own. And then we kind of realized we could make this much easier for others.”
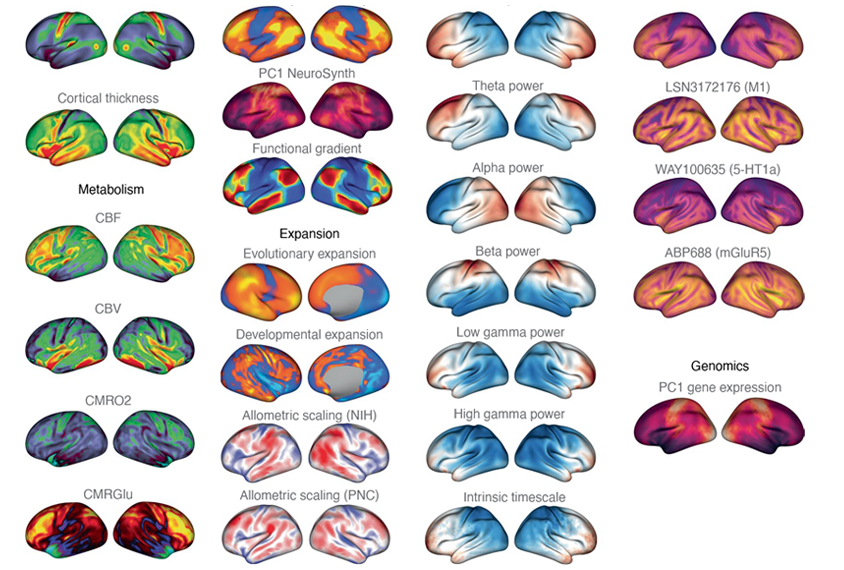
To apply the tool to study a particular condition, such as autism, a researcher could theoretically take MRI scans of people with the condition and compare the scans with other types of data to “see exactly what cell types are affected, or what types of electrophysiological rhythms are affected, or what types of neurotransmitter receptors their map is enriched for,” Misic says. “And these comparisons can guide them to the next step and help to design the next experiment.”
A
Cortical thinning — a part of normal aging that happens faster in people with certain neurological conditions, such as schizophrenia — was most severe in those regions of the brain that grow most during development, they found. The findings provide further evidence that schizophrenia is a neurodevelopmental condition that affects how the brain develops in adolescence.
A decade ago, any analysis that drew upon so many disparate datasets would have been done manually, one step at a time, Voytek says. Finding, downloading, transforming and running statistical analyses across brain maps could take months and required specialized training.
Instructions to download and use the tool, written using the Python programming language, are described on the neuromaps website, along with examples.
Because the tool is openly available, many people have already suggested improvements on GitHub. One user suggested a rewrite that dramatically accelerated the code’s function. “A pipeline that took 15 minutes to run now runs in, like, 10 seconds,” Hansen says.
As the neuromaps community grows, researchers can swap datasets, quickly compare them and devise new hypotheses, Voytek says. “And that’s really powerful.”