A new computer-guided method can point researchers to the most promising techniques to process their neuroimaging data. The approach could help address the problem of poor reproducibility across brain imaging studies of autism, according to a new paper.
So-called ‘pipelines’ for analyzing brain imaging data can differ in how they remove noise, divide the brain into sections and define connectivity, among other variables. “Lots of those design analysis decisions actually can change results in all kinds of ways. So we end up with this really fragmented literature,” says lead investigator Robert Leech, professor of neuroimaging analytics at King’s College London in the United Kingdom.
But when researchers collect new brain images for analysis, it is not always immediately clear what the most appropriate pipeline is. Some researchers stick with the same pipeline no matter what. Others opt for many different pipelines, but that approach takes a lot of computing power, can cause statistical problems from analyzing the same data multiple times and may yield results that are ‘overfitted’ to a small amount of data and don’t generalize.
Leech and his colleagues developed a two-step computational process to plot the way out of this morass.
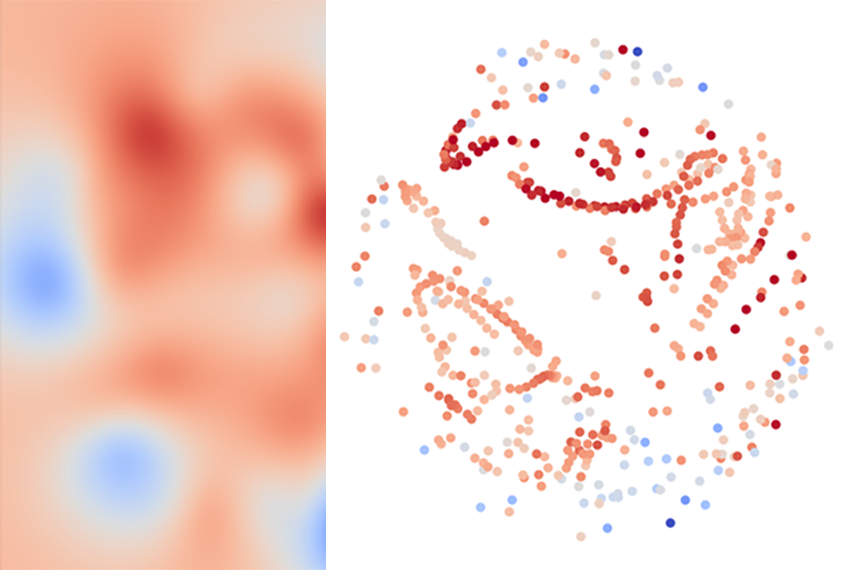
In the first step, for any given set of brain images, a well-established algorithm creates a map of all the different analysis pipelines that could be used. Pipelines that tend to produce similar results are clustered close together on the map, regardless of the techniques they employ.
Then, machine learning tests the performance of just a few pipelines from different regions of the map on a subset of the data to home in on the most effective ones. Based on this sampling, the algorithm estimates the performance of other nearby pipelines and identifies the most accurate clusters.
“It takes a dataset and it searches through lots of possible analyses in a small section of it, and then it can take the consequence of that analysis to inform an analysis of the bigger” portion of the data, says study team member Jonathan Smallwood, professor of psychology at Queen’s University in Kingston, Ontario, Canada. “This approach is very clever because it just means that you never have to compromise.”
The work was published in June in Nature Communications, and the researchers have made the code for it freely available online.
D
epending on the goal of a study, researchers can use the method either in an exploratory way, to thoroughly map the pipeline possibilities, or in an exploitative way, to identify the top-performing pipeline with as few samples as possible. The basic approach could be used to answer a variety of different functional and structural imaging questions, the researchers say.The method is an “elegant” solution to the problem of choosing a processing pipeline, says Annika Linke, research assistant professor in the Brain Development Imaging Laboratories at San Diego State University in California, who was not involved in the study. “It’s a principled and transparent approach to identify how different analysis choices relate and impact results that, given the openly shared code, could easily be applied to future studies.”
To demonstrate its capabilities, Leech and his team analyzed two existing functional connectivity datasets.
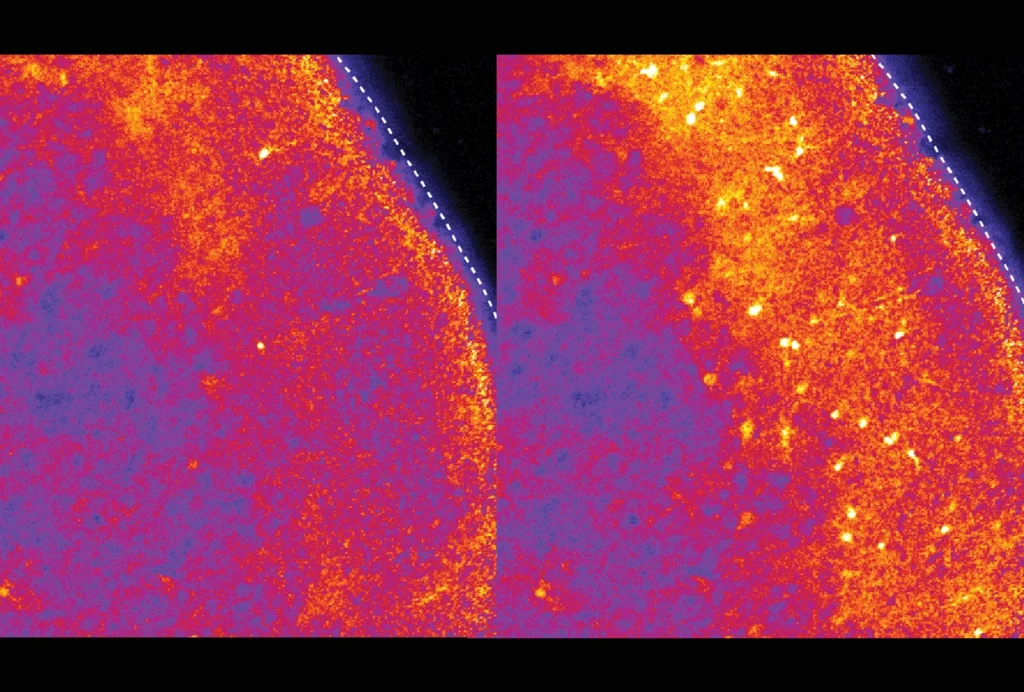
In one analysis of 520 scans from 298 14- to 26-year-olds, the researchers used their method to sift through 544 different pipelines and identify those that best predicted a person’s age. In another analysis, they fed data from 406 autistic people and 476 neurotypical people from the Autism Brain Imaging Data Exchange through 384 different analysis pipelines to identify which ones best distinguished between the two groups.
The goal of the exercise was to show how the method works and how it can be used — not to identify the best pipeline in every case. (There is no such thing, the researchers say.)
Still, the analysis turned up some intriguing patterns. For the autism dataset, for example, how a pipeline divided the brain into smaller regions didn’t significantly affect results, but definitions of connectivity did.
There are still many reasons — such as age differences between cohorts, the heterogeneity of autism and so on — why autism brain-imaging studies might yield disparate results that can’t be addressed by this method, Linke cautions. But, she says, the approach is promising enough that she plans to apply it to one of her lab’s datasets.
Cite this article: https://doi.org/10.53053/VYIR9955