Listen to this story:
0:00
/
Methodological choices and study-site artifacts confounded an attempt to replicate findings in support of an autism brain-imaging biomarker, according to new unpublished work.
Nicolas Traut is a skeptic. It’s an attitude that serves him well, he says, as a research engineer in Roberto Toro’s lab at the Institut Pasteur in Paris, France, where he and his colleagues work to verify findings from structural MRI studies of autism and other conditions.
Two such findings, of increased cerebellum volume and diminished corpus collosum size in autistic people compared with non-autistic people, failed to replicate on the team’s first two attempts over the past decade. So they were recently surprised when a third try appeared to shore up a 2021 study suggesting that autistic and non-autistic people have different levels of contrast where gray and white matter in the brain meet, says Toro, who led the work.
But Traut couldn’t leave it at that; he had to know what was behind the difference, Toro says. And after Traut dug into the dataset used in the 2021 work — the Autism Brain Imaging Data Exchange (ABIDE), which includes brain scans collected across 26 international sites — he turned up something even more unexpected, according to Toro: The findings could be pinned to scans from a single study site — an apparent artifact.
Sure enough, when Toro’s team removed that site from their analysis, the effect disappeared, and the contrast measure was indistinguishable between autistic and non-autistic participants. They posted their findings, which have not yet undergone peer review, to bioRxiv in January.
Imaging researchers have been discussing the field’s “replication crisis” for more than a decade, and the new study highlights why it remains a difficult problem, says Armin Raznahan, chief of the Section on Developmental Neurogenomics at the U.S. National Institute of Mental Health, who was not involved in the work. With each choice a researcher makes in analyzing their data, he says, they are shaping their eventual results in ways that are tough to identify.
The study, Raznahan adds, is “a really nice example of how complicated a seemingly straightforward question is.” For many such questions, the answer is almost always “it depends.”
B
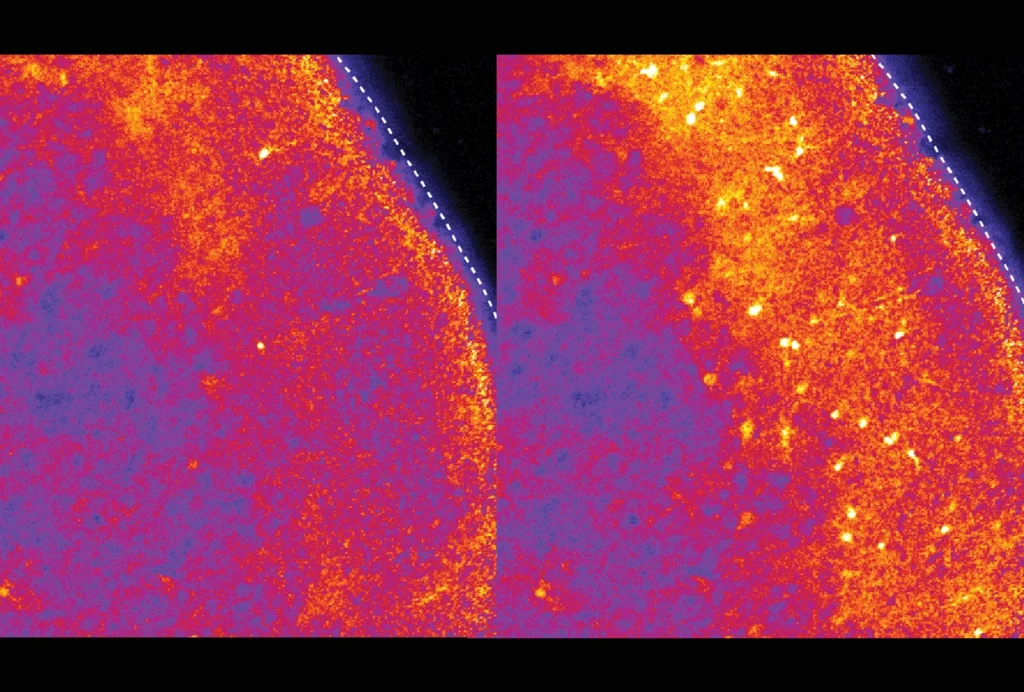
Brain tissue thick with myelin, the fatty substance that coats axons, appears white on these scans; tissue full of neurons’ cell bodies, on the other hand, is rendered gray. Two previous studies turned up conflicting results about the boundary between these two tissue types in autistic people: A 2017 study reported a decrease in contrast at the boundary, whereas a 2021 study, which used a different analysis, showed a contrast increase in certain parts of the brain.
For the new work, Toro and his colleagues sought to clear up this discrepancy. After excluding scans from the ABIDE dataset that were missing information (such as a participant’s diagnosis, sex or age) or had poor-quality data, the team had scans from 636 autistic participants and 839 neurotypical participants.
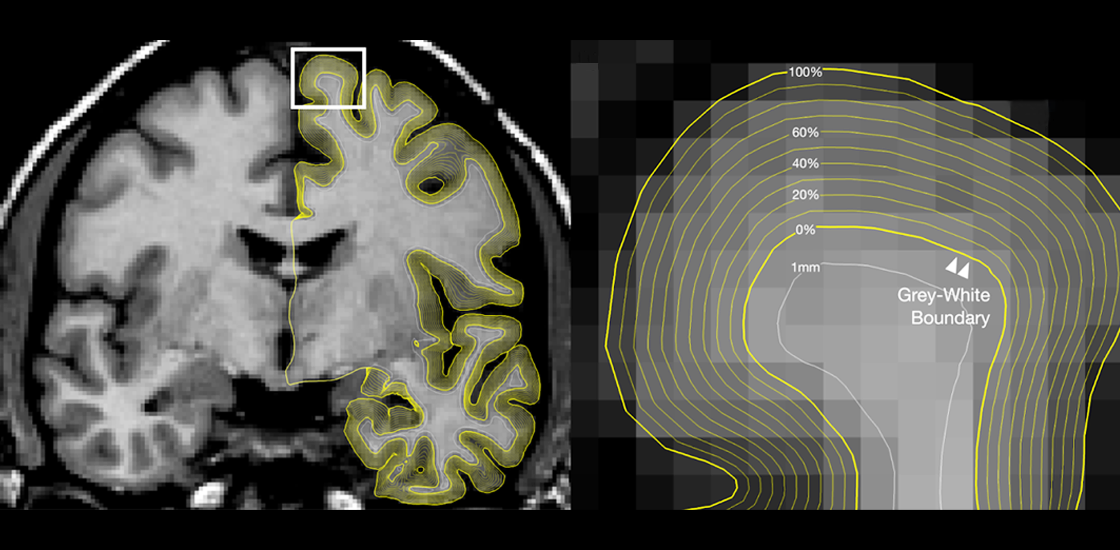
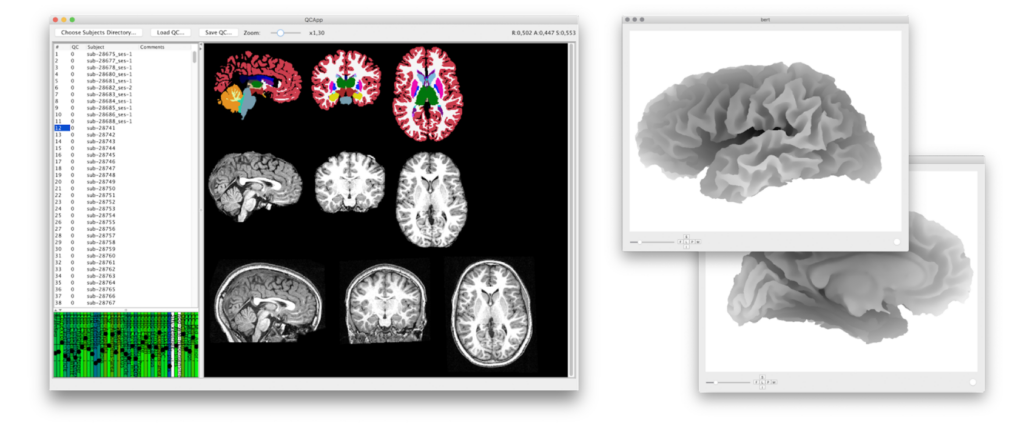
The researchers used an algorithm to identify in each scan the location with the largest change in signal intensity from one pixel to the next, and then calculate the ratio of the intensity on either side of the boundary. A lower ratio indicates lower contrast between the two regions.
Initial analyses using all 26 ABIDE sites showed, like the original studies, that autistic and non-autistic people had significantly different patterns of boundary contrast. The effect, however, stemmed entirely from data collected at New York University, the team found.
In support of this result, the team found no differences in boundary contrast on scans from 453 autistic people and 311 non-autistic people who are part of the independent EU-AIMS study, a multisite European effort to identify autism biomarkers.
T
Experts have long criticized ABIDE for the lack of standardization across study sites, as it makes it difficult to generalize across datasets, and the new findings highlight the problem with those inconsistencies. It may be, for example, that researchers at the NYU site regularly scanned either their autistic or non-autistic participants first, which would have introduced “signal drift” into the dataset, with the scans’ intensity diminishing over time, Toro says. That could result in one group having a higher average scan intensity, and thus an artificial difference in contrast between the groups.
Or perhaps the difference is not artificial at all, says Adriana Di Martino, research director of the Autism Center at the Child Mind Institute in New York City and director of ABIDE. Autism is a highly heterogeneous condition, which may have obscured signals in datasets smaller than NYU’s, she says. It is difficult to know at this stage, Di Martino says, but this sort of cross-site comparison illustrates the benefit of a dataset such as ABIDE. “This is exactly the advantage of open science.”
In addition to revealing differences across study sites, the new work also highlights how methodological choices across studies may lead to discrepancies in their findings, Toro says. The 2017 study that found a difference in boundary contrast between autistic and non-autistic people was small — 98 participants for each group — so its results could be a fluke. The 2021 paper, on the other hand, had a sample larger than the one Toro and his colleagues used — data from a private dataset, in addition to ABIDE — which may have affected the results. And those researchers used a different measure of contrast and had different criteria for scan inclusion than what Toro and his colleagues used.
The new study “didn’t necessarily use the same subset of individuals from ABIDE that we used,” says Mallar Chakravarty, associate professor of psychiatry at McGill University in Montreal, Canada, who led the 2021 paper. The quality control he and his team did was “really stringent.” Taking a different decision on borderline scans, he adds, “might change the signatures that you get.”
It is also possible that the biomarker found in the 2021 study is an artifact, Raznahan says. “It may well be that there is no biological feature you could measure that would consistently differentiate people with ASD from people without,” he says. Alternatively, “the signal that we’re seeking may, inconveniently, not be captured by the measurement method that we happen to have.”
Going forward, it may be helpful to borrow an approach from the genetics field, Toro says: making a community effort to collect large swaths of data.
Raznahan agrees. The work, he says, points to “the soundest way we can move forward, which is going to full transparency of code and results — and remaining agnostic.”